This article originally appeared in the October 2016 issue of Growing for Market Magazine.
During the growing season, if you want to earn more profits, the first thing that probably comes to mind is to grow and harvest more, so that you can sell more. It seems logical. But what if you discovered you only earned 10 cents a pound on tomatoes. With those margins, you couldn’t work hard enough to make any real profits.
Working smarter means understanding your costs and pricing your products appropriately. You can maximize your profits without working harder.
Perhaps the most straightforward way to increase profits without any real effort is to increase prices. But that’s not as easy as it sounds…If you increase prices, will your customers still buy from you? And what is the right price, anyway? 10% increase? 20% increase?
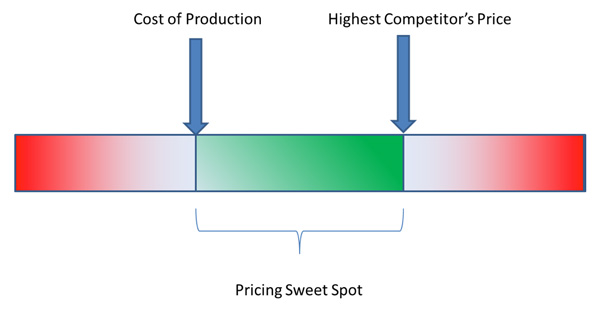
As you think about your pricing strategy, you’ll want to focus on two elements: an internal analysis of costs and an external analysis of the competitive landscape. Obviously, you want to set your prices higher than what it costs you to grow whatever it is that you sell. But you don’t want to charge higher than the competition’s highest price. Somewhere in the middle is the right price.
So, how do you get there?
Cost of production
How much does it cost to produce a skein of yarn, a bouquet of flowers, a gallon of milk or a case of tomatoes? There are so many little things that go into any one item; it can be mind-boggling to tease it all apart.
There are three categories of costs:
Direct costs
Labor
Overhead (or sunk) costs
Direct costs
The direct costs are the cost of the seeds, black plastic, stakes and packaging. It’s the cardboard boxes that you pack your tomatoes in, or the plastic bottles for the milk. It’s also the fuel for the tractor and delivery van, the dyes for your yarns, or the feed for your animals.
Some of these costs are easily applied to your products. Let’s say that for an acre of tomatoes, you purchase:
Potting mix: $660
Seed trays: $135
Seeds: $136
Black plastic mulch: $650
Amendments (including cover crops, fertilizer): $375
Stakes and ties: $4,128
The total cost is $6,084. If an acre of tomatoes yields 20,000 pounds, then the cost of these supplies per pound of tomatoes is 30 cents (6084/20000).
Other costs are more difficult to allocate. The tractor, for example, can prepare your tomato beds and cucumber beds as well as your chicken pasture all in the same day. How do you allocate the cost of fueling, maintaining and depreciating your tractor to each product? These are direct costs, but not easily allocated to any one item. Perhaps the easiest approach is to allocate a percentage of these costs to each product based on production. If 20% of your acreage is utilized for tomatoes, then 20% of these direct operating expenses would be allocated for the tomato production.
If the farm accrues $18,000 in these kinds of general operating expenses, then $3,600 would be allocated to tomatoes. And if you grew 20,000 pounds of tomatoes, then these costs are 18 cents for each pound of tomatoes.
Labor
Similarly, you need to factor in your labor, as well as that of your crew. What does it cost to get your product into the ground, out of the ground and to market? As you add up all the labor (number of hours multiplied by the hourly wage, plus payroll taxes), be sure to include the cost of your labor. And I don’t mean the $2/hour you earn if you factor all your time relative to the amount of money you actually draw from the business. I mean, $15 - $20/hour or whatever you pay your crew. After all, if you are not putting in time, then you are paying someone else to do the work. This is a real cost that should not be overlooked.

Overhead (sunk) costs
Finally, there are sunk costs; though most people refer to them as “overhead.” I call them sunk because whether you grow 1 acre of tomatoes, or 20 acres, you still need to pay your phone bill, insurance, mortgage and so on; and cutting back on production won’t diminish these costs. As such you want to factor them into the cost of production. You can allocate these costs as a percentage of acreage in production like above, or you can allocate as a percentage of revenue. If you earn $70,000 from tomatoes, and that’s 8% of total revenue; then 8% of these sunk costs should be allocated to tomato production. If the sunk costs total $65,000 per year, then $5,200 would be applied to the tomatoes. And with a yield of 20,000 tomatoes per year, that’s 26 cents for each pound of tomatoes.
Doing this sort of analysis on all your crops and products is tedious, and may not feel like “working smarter, not harder.” I don’t expect or even suggest that you do it for every single thing you produce. I recommend that you do this analysis with at least 3 to 5 of your crops or products — focusing on the products that you sell the most of or your gut tells you are the least profitable. Once you do it a few times, you’ll develop your intuition of the numbers, and you’ll be able to do future analysis in your head with a dose of gut instinct.
For more detailed tutorials on this kind of analysis, you can read my book, The Farmer’s Office or Richard Wiswall’s The Organic Farmer’s Business Handbook, both available from growingformarket.com.
Competitive analysis
After all that analysis, you may realize that you need to charge $4 per pound of tomatoes. That’s all well and good, but how can you be sure that’s the best price? This brings in the second element: knowing what the competition charges. For example, after reviewing the competition, you may see that others are charging $5 per pound for a comparable tomato. This suggests that you have room to charge a higher price and still be competitive.
Most commonly, competitive analysis identifies gaps in the marketplace and helps a business owner best position her products for her customers. It is also an important tool for developing a better pricing strategy. But how do you compare your prices to the competition when many of the features and benefits are different? It’s like comparing apples and oranges.
Competitive analysis helps you understand how your prices compare to the others in the market; it allows you to make an informed decision of how you want to position yourself. After you’ve identified your competition (and this can include the local grocery store too), compare your features with theirs, and calculate an adjusted price for each competitor’s product. Here’s an overview of the process:
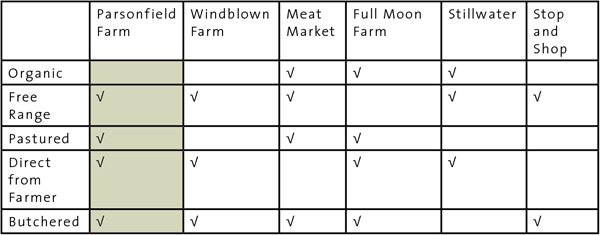
The chart below shows how Parsonfield Farm compares the features of its chicken to the competition.
STEP 1: List all features of your product; then, create a table identifying which competitors have each of those features
STEP 2: Assign a dollar value to each feature
STEP 3: Add or subtract these values from each competitor’s base price in order to compare their prices accurately to your own price
STEP 4: Determine what to do with your price, based on this analysis of the competition
We can talk about this process using a make believe poultry farm – Parsonfield Farm owned by Mary.
STEP 1: List all features of your product; then, create a table identifying which competitors have each of those features
Mary raises chickens. After evaluating her cost of production, Mary is concerned that her prices are too low for a financially sustainable business. As she considers her pricing compared to the competitions, she realizes that every seller offers different features, based on how the birds are raised and sold. To analyze her competition, she puts all of the competing sellers into a table, and lists which feature(s) each seller offers:
STEP 2: Assign a price value to each feature
Now we can see how Parsonfield chicken stacks up against the competition in terms of who offers which features, but how does this inform price? In order to decide on the value of each feature, Mary did a little research. She went to the grocery store and noted how chickens were priced. With the wide variety of organic, free-range, and conventional chicken on sale, she had a good gauge. She also used pricing information gleaned during negotiations with a meat market. She decided on the following prices for each feature (please note: these numbers are for instructional purposes only and are not based on fact or real markets):
Organic allows a farmer to charge $2 more per pound.
Free range is worth an extra $1.50 per pound.
Pastured chicken could command $1 more per pound.
Chicken bought directly from the farmer merits a $2 per pound price reduction.
Butchered chicken (cut up into pieces) is worth an extra $3 per pound
STEP 3: Add or subtract these values from each competitor’s base price to compare their prices accurately to your own price
Because we want to compare everyone’s prices to Mary’s, we want all differentials to be adjusted to be comparable with Parsonfield Farm chicken. Therefore, competitors’ prices will be added to and subtracted from, based on how their products compare with Parsonfield’s. Parsonfield’s base price will stay the same.
For example, if Mary’s chicken does not have a feature, she will subtract the designated value of that feature from the prices of the farms that do have the feature:
Because Parsonfield chicken is not organic, in order to make an equivalent comparison, Mary must discount (or lower) by $2 per pound the price of the chicken from farms that are organic
Alternatively, if Parsonfield chicken has a particular feature, Mary will add the designated value of that feature to the prices for the farms whose chicken do not have that feature. For example:
She will add $1.50 and $1, respectively, to the prices for farms whose chickens are not free range and not pastured, as hers are.
The farms selling through distributors will have $2 added to their prices.
Because Stillwater Farm sells only whole birds, Mary will add $3 per pound to their price for not butchering their chicken, as she does.
This information can all be logged onto the table Mary previously made by replacing each differing feature with price values. Mary will then sum the columns to calculate the adjusted price:
STEP 4: Determine what to do with your price, based on this analysis of the competition
These price adjustments — based on the competition’s features — indicate that Mary was charging at the lowest end of the pricing spectrum, even though, before the analysis, she may have thought her prices were in the mid-range. Having done this analysis, Mary felt comfortable raising her price.
After reviewing your cost of production and the competition, you will home in on the right price for your products. It may be higher than your current prices.
This section was written in partnership with The Carrot Project (thecarrotproject.net), a New England non-profit focused on creating a sustainable local farm and food economy.
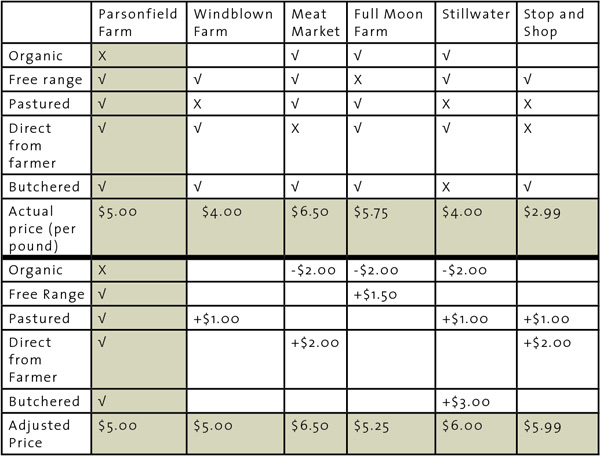 The top part of the table above shows how Parsonfield Farm identifies the features of their chicken compared to the competition. In the bottom half of the chart, they assign a value to those differences to come up with an adjusted price; this way they can compare the relative value of similar products on the market.
Communicating value
Raising prices can feel scary…will your customers still buy from you? The good news is that most of your customers do not shop on price alone. If they do, then they are not long-term clients and will drop you as soon as they find someone else selling at a lower price. You do not want to get into a price war; you will lose. But if you charge more, then your customers will want to understand why your products are priced differently than the competition.
Here in Boston, we have a farmer that consistently charges more for his products than anyone else: the weekly cost of his CSA is $50 compared to most other farms that charge $23 - 32. And his CSA always sells out! Is his CSA that much better than the competition? Maybe. Whether it is or not, he’s figured out how to communicate the value to his customers as to why he charges more.
If you charge more than the competition, then communicate to your customers why. Maybe you have better customer service, provide more variety (or better varieties), or utilize better growing practices.
Through the above competitive analysis, you know how you’re different. And you can explain your differences not just through direct words spoken to your customers, but through your branding, signage and actions.
In order to maximize your profits – understand your cost of production, know how you differ from the competition, and communicate your value to your customers. You’ll be working smarter, not harder.
For an even more detailed understanding of farm business financials, Julia designed The Farmer's Edge, a ten-week, self-paced course to help you take control of your business financials. The next course starts December 10, focusing on accounting, Quickbooks, setting up systems, business and financial analysis and more. At the end of the course you will have a plan to increase profits! Register now for the course that goes until February 25, and start next season with a higher level of financial competence and confidence!
Julia Shanks works with food and agricultural entrepreneurs to help them achieve financial and operational sustainability. She provides technical assistance and business coaching that enables them to launch, stabilize and grow their ventures. She is a frequent lecturer on sustainable food systems, accounting and small business management.
Julia is co-author of The Farmers Market Cookbook which received critical praise from The Boston Globe, The Boston Herald and Taste of the Seacoast; and was cited as a reference in Michelle Obama’s American Grown. Her second book, The Farmer’s Office was released in September 2016. Both of Julia’s books are available from growingformarket.com.
Visit Julia’s website (juliashanks.com) for more articles, tools and tips for growing entrepreneurs.

 For most established growers, the easiest place to start selling flowers will be mixed bouquets and single stem/small bunch retail sales. These are the flowers you can sell to your existing customers and they are easy to incorporate into farmers market, CSA, and grocery sales. But there are lots of other outlets out there, including florists, weddings and events, business subscriptions, value added products, and wholesalers.
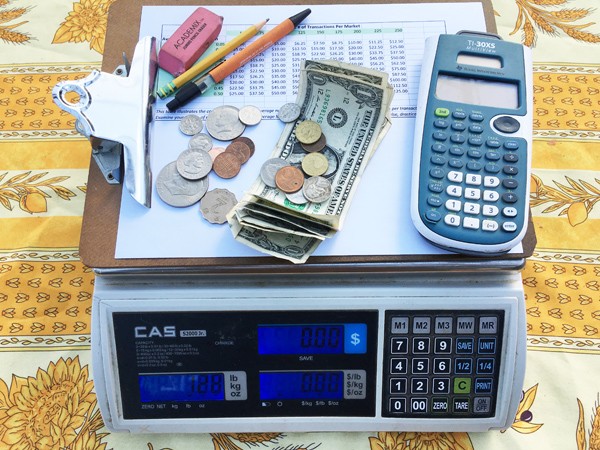 Rounding is a pricing strategy whereby smaller denominations are excluded from the grand total at checkout. That means pennies, nickels and dimes. The principal incentive for rounding at the farmers market is to expedite the checkout process.