This article originally appeared in the February 2020 issue of Growing for Market Magazine.
I’ve been teaching business skills and financial management to farmers for over ten years. When I started out, I was fresh out of business school and teaching college accounting. I was very academic in my approach.
Over the years, I’ve adapted my approach to what resonates with my clients and “students.”
The one topic that has resonated more than any other – and I now include in every presentation – is the breakeven formula. When I share it, I can see eyes light up … it helps to clarify goals for the farm business. It turns “increase sales” to “increase sales to a specific goal.” And as we all know, the more clearly you can define a goal, the better the chance you can achieve it.
The breakeven formula is magical. It tells you what you need to sell – that is, how much revenue does your business need to generate – in order to cover all your expenses. It’s something all business owners think about but wrapping your head around the actual number can be a mind-twist. After all, as you sell more, you have more expenses. The expenses are a moving target, so how do you home in on the right sales number?
Breakeven analysis also fits into the context of general pricing strategies. In October 2016, I wrote an article here about finding the right price for your products. We talked about understanding your cost of production (the floor for which you should sell your products) and what the market will bear (the high end of what you should charge).
What we didn’t address is the need to cover your overhead and profit. That is, when you think about how to price your products, you want to (of course) cover your cost of production, but you also need to generate enough revenue to cover your overhead, debt and have enough left over to pay yourself and reinvest in the business.
Calculating breakeven is easier than most people think; which is perhaps why it’s so magical. Its beauty is in its simplicity.
In this article, we will go over how to calculate your break-even sales volume, and then use that number to come up with a sales plan. We’ll also discuss how the breakeven formula can help you evaluate new sales opportunities.
Before I get into the actual formula, I want to clarify a few key concepts. I realize they are familiar to most of you. That said, I’ve found that while most farmers understand these terms, they’re not always clear on how they apply to financial analysis. It’s helpful to make sure we’re all on the same page.
Fixed vs variable costs
What are the drivers of your expenses? What causes an expense to increase or stay stable? Some expenses, like your liability insurance, don’t increase directly as the result of production. It may increase in a step-function with revenue, but it’s independent of production. Likewise, the fee your accountant charges you to file your taxes or the cost of maintaining your website don’t change no matter your sales volume. These are your fixed costs. They are fixed relative to your production.
On the other side are the costs that increase with your production levels. As you grow more vegetables, raise more chickens, or harvest more honey, you have expenses that increase. If you grow more tomatoes, you buy more seeds, need more potting soil and hire more labor to seed, transplant, weed and harvest. You buy more quart containers to use at the farmers’ market.
The more you grow, the more expenses you have. These are your variable costs – they vary based on your production levels. Certainly, all costs vary, but the “variable costs” vary directly according to your sales and production volume.
When we talk about variable costs, we refer to them in terms of a percentage. Let’s say we looked at your profit and loss at the end of the year and the revenue was $100,000, and our total labor costs were $30,000. We would refer to our labor costs as 30%. If we spent $4,000 on seeds and seedlings, our seed expense was 4% of revenue.
If we want to increase our sales to, let’s say, $120,0000; then we can expect our labor and seed expenses will increase proportionally. If our seed expense stays at 4%, then we can budget $4,800 for seeds (4% of $120,000). Likewise, we can budget $36,000 (30% of $120,000) for labor.
As a side note, this brings into play how we maintain our books (and set-up our chart of accounts in QuickBooks: Workers’ comp insurance is pegged to wages, so that too is variable. On the other hand, liability insurance will stay stable around $1,200 (or a standard annual increase unrelated to our sales volume).
Lumping all of your insurance into one bucket (as the Schedule F tax form would suggest) makes it difficult to really see your variable costs and your fixed costs. To learn more about setting up your QuickBooks you can view the video tutorials on my website, thefarmersoffice.com.
Gross profit and margin
When we go to the farmers market or deliver to our CSA customers, the production costs are assumed. If we think about our profits, we need to first write off our production costs, and what’s left over is what we have to cover our overhead costs. That “leftover” after we’ve covered our production costs is our gross profit.
Gross profit is a funny thing – we all know the term, but it’s not always used to mean the same thing. As a technical note: when we talk about “margins” we’re talking about percentages; “profits” are the actual number.
Going back to the earlier example of the farm generating $100,000 in revenue. If they have $10,000 left after all their expenses are paid: their profit margin is 10%; the net profit is $10,000. If our production costs are $42,000 (production supplies and labor),
Our production (variable) costs are 42% of revenue
Gross profit is $58,000
Gross margin is 58%.
In other words, for every dollar of produce, meat, flowers or fiber we sell, we can expect to spend 42 cents on production and have 58 cents left over to cover our overhead and still have something left to pay ourselves, reinvest in our business, save for retirement, pay our debt, etc.
Which leads us to our next concept….
Desired profit
When we think about “breakeven” in general terms, we think about covering our farm expenses, but I want to expand our definition to include our desired profit. And to be clear, profit is not a four-letter word. We need profit in our business to live whole-hearted lives – to be able to take a vacation, save for retirement, pay for our kids’ education, put clothes on our backs and food on our tables.
We also need profit so we can cover our debt (mortgage, student loans, credit cards, etc.…) and reinvest in our business. If we want to recover the greenhouse, or improve the livestock housing, we need to save.
What is your desired profit? Take a few minutes (or more) to write out what you need over the course of a year for:
Personal living expenses
Making regular payments on your debt
Saving for personal purposes like retirement, kids’ education and personal needs like vacations or new clothes.
Savings for business goals like building a new packing room or purchasing a new cooler.
Calculating breakeven
Step 1 - Gather your numbers
In the last section, you calculated your desired profit. Now we need to understand your fixed and variable costs. Go to your bookkeeping system and run a profit and loss for the last year. If you’re using QuickBooks: customize the report to add a column for expenses as percent of income and export the report into Excel.
It’s easiest if you can do this in Excel, put paper and pen will work too. Go through each expense line item and decide if it’s a variable expense or a fixed expense. Does the expense vary based on production, or does it vary independent of production volume? In one column, list the expenses that are variable; and note the percentage. In a second column, list your fixed expenses.
For the variable costs – add up all the percentages for a total “cost of production” percentage. Add up all the fixed expenses and note the dollar amount.
Step 2 - The breakeven formula
Here’s the formula:
*drum roll*
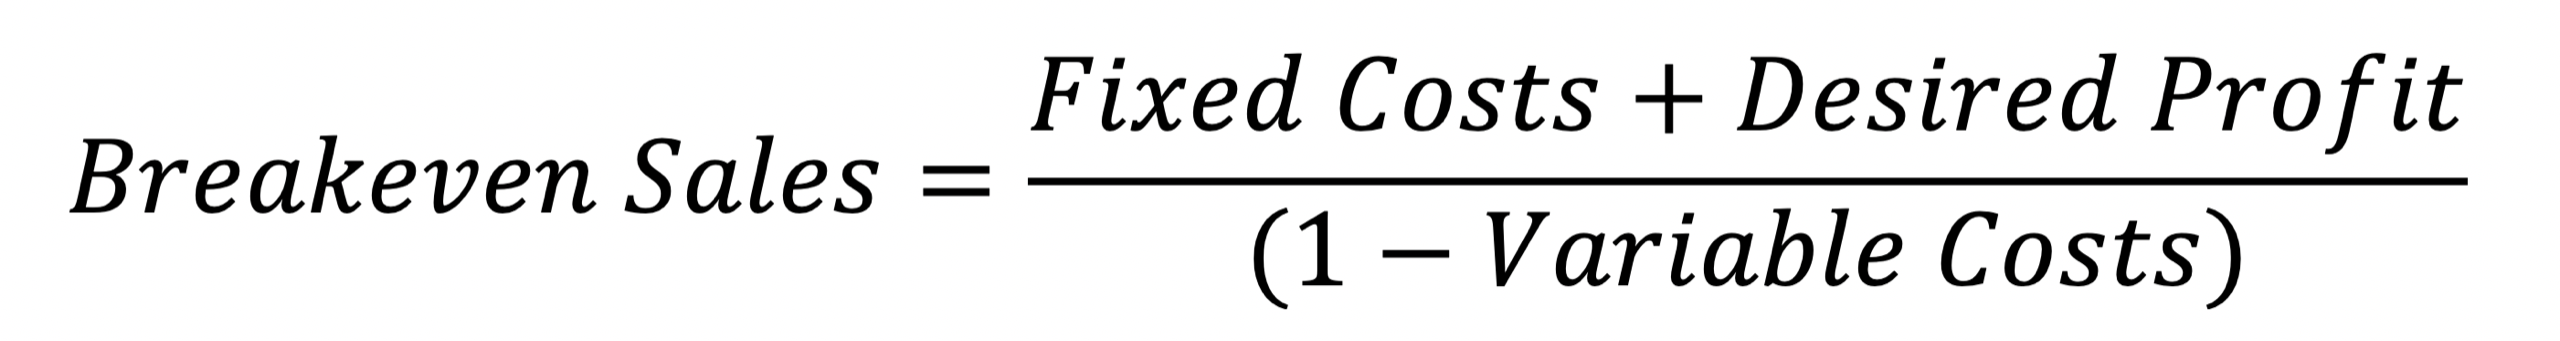
Note – if you calculated the variable costs as a percentage, then (1-variable costs) is the same as your gross margin.
Let’s look at an example to see the formula in action: Dixon Farm is a vegetable and livestock farm in southeastern Massachusetts. They’ve been in business for 3 years. Farmer Dana wants to pay herself $50,000 a year and start saving $20,000 per year so she can purchase her own land.
Here are her financials:
** Note this example is simplified. Actual financials will be more detailed and nuanced. It may be that some of the line items within each of these broad categories are fixed and some are variable.
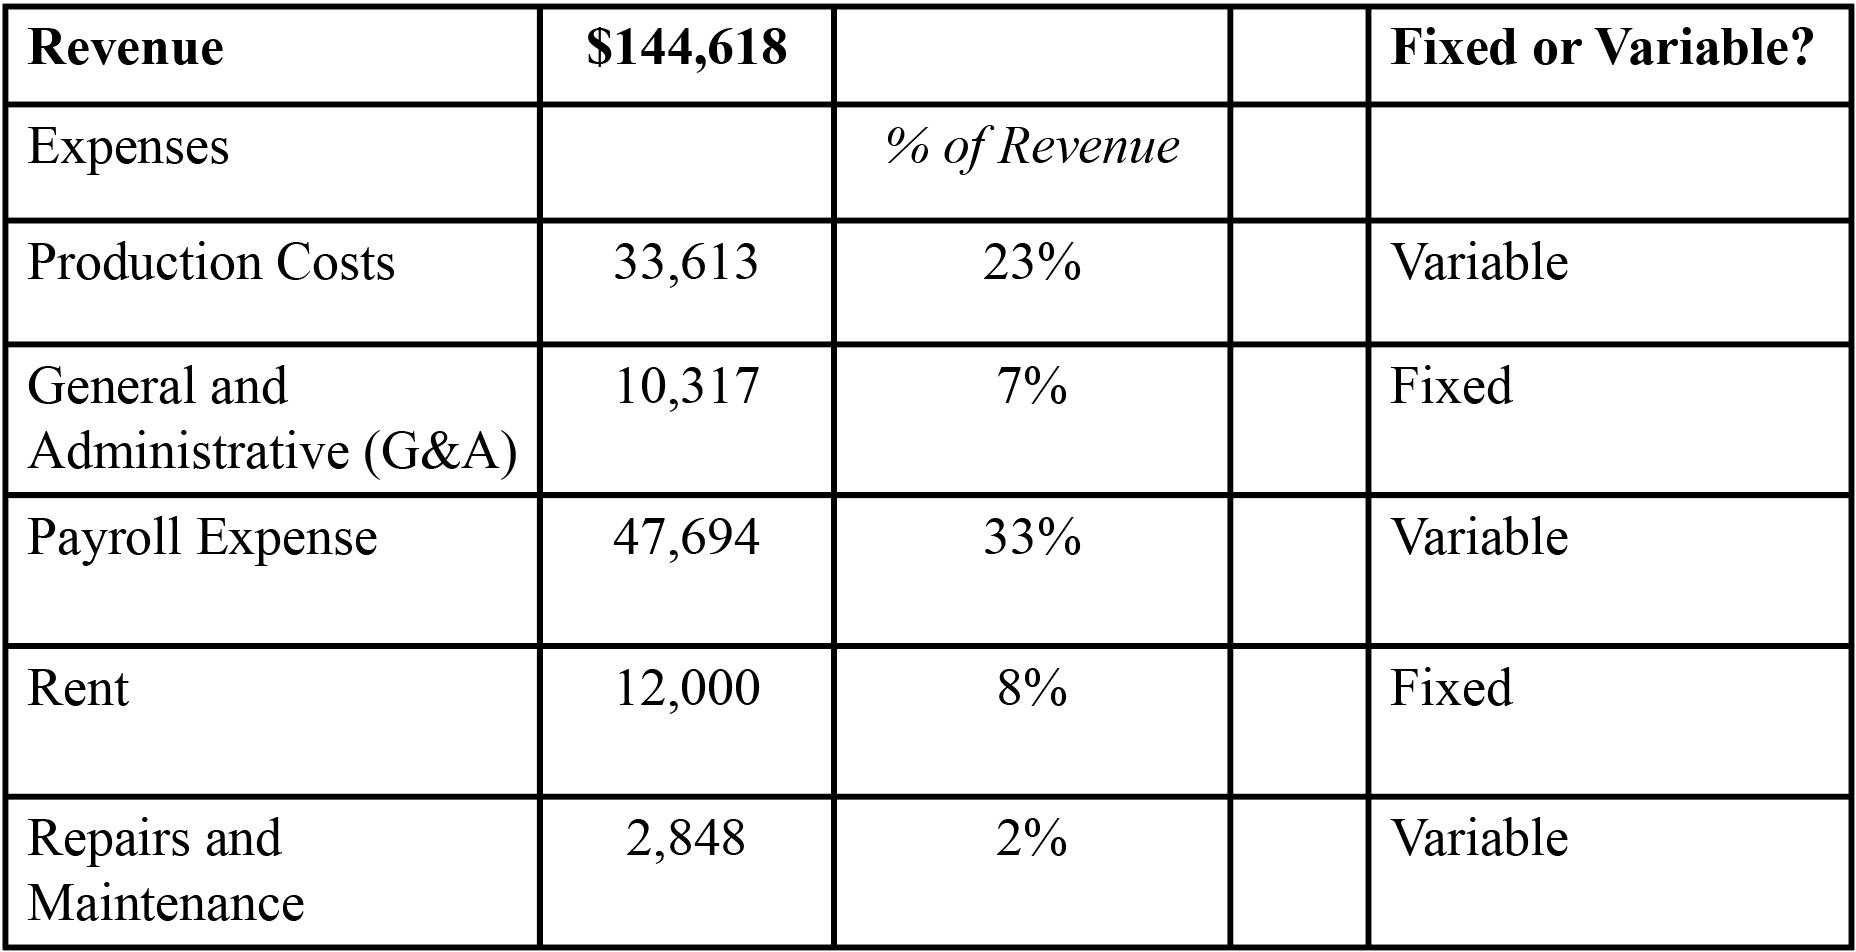
She goes through the financials, and determines that production costs, payroll and repairs and maintenance are variable expenses. And the G&A and rent are fixed. She adds up the numbers and gets: $22,317 in fixed costs and 58% in variable costs.
She plugs her numbers into the breakeven formula:
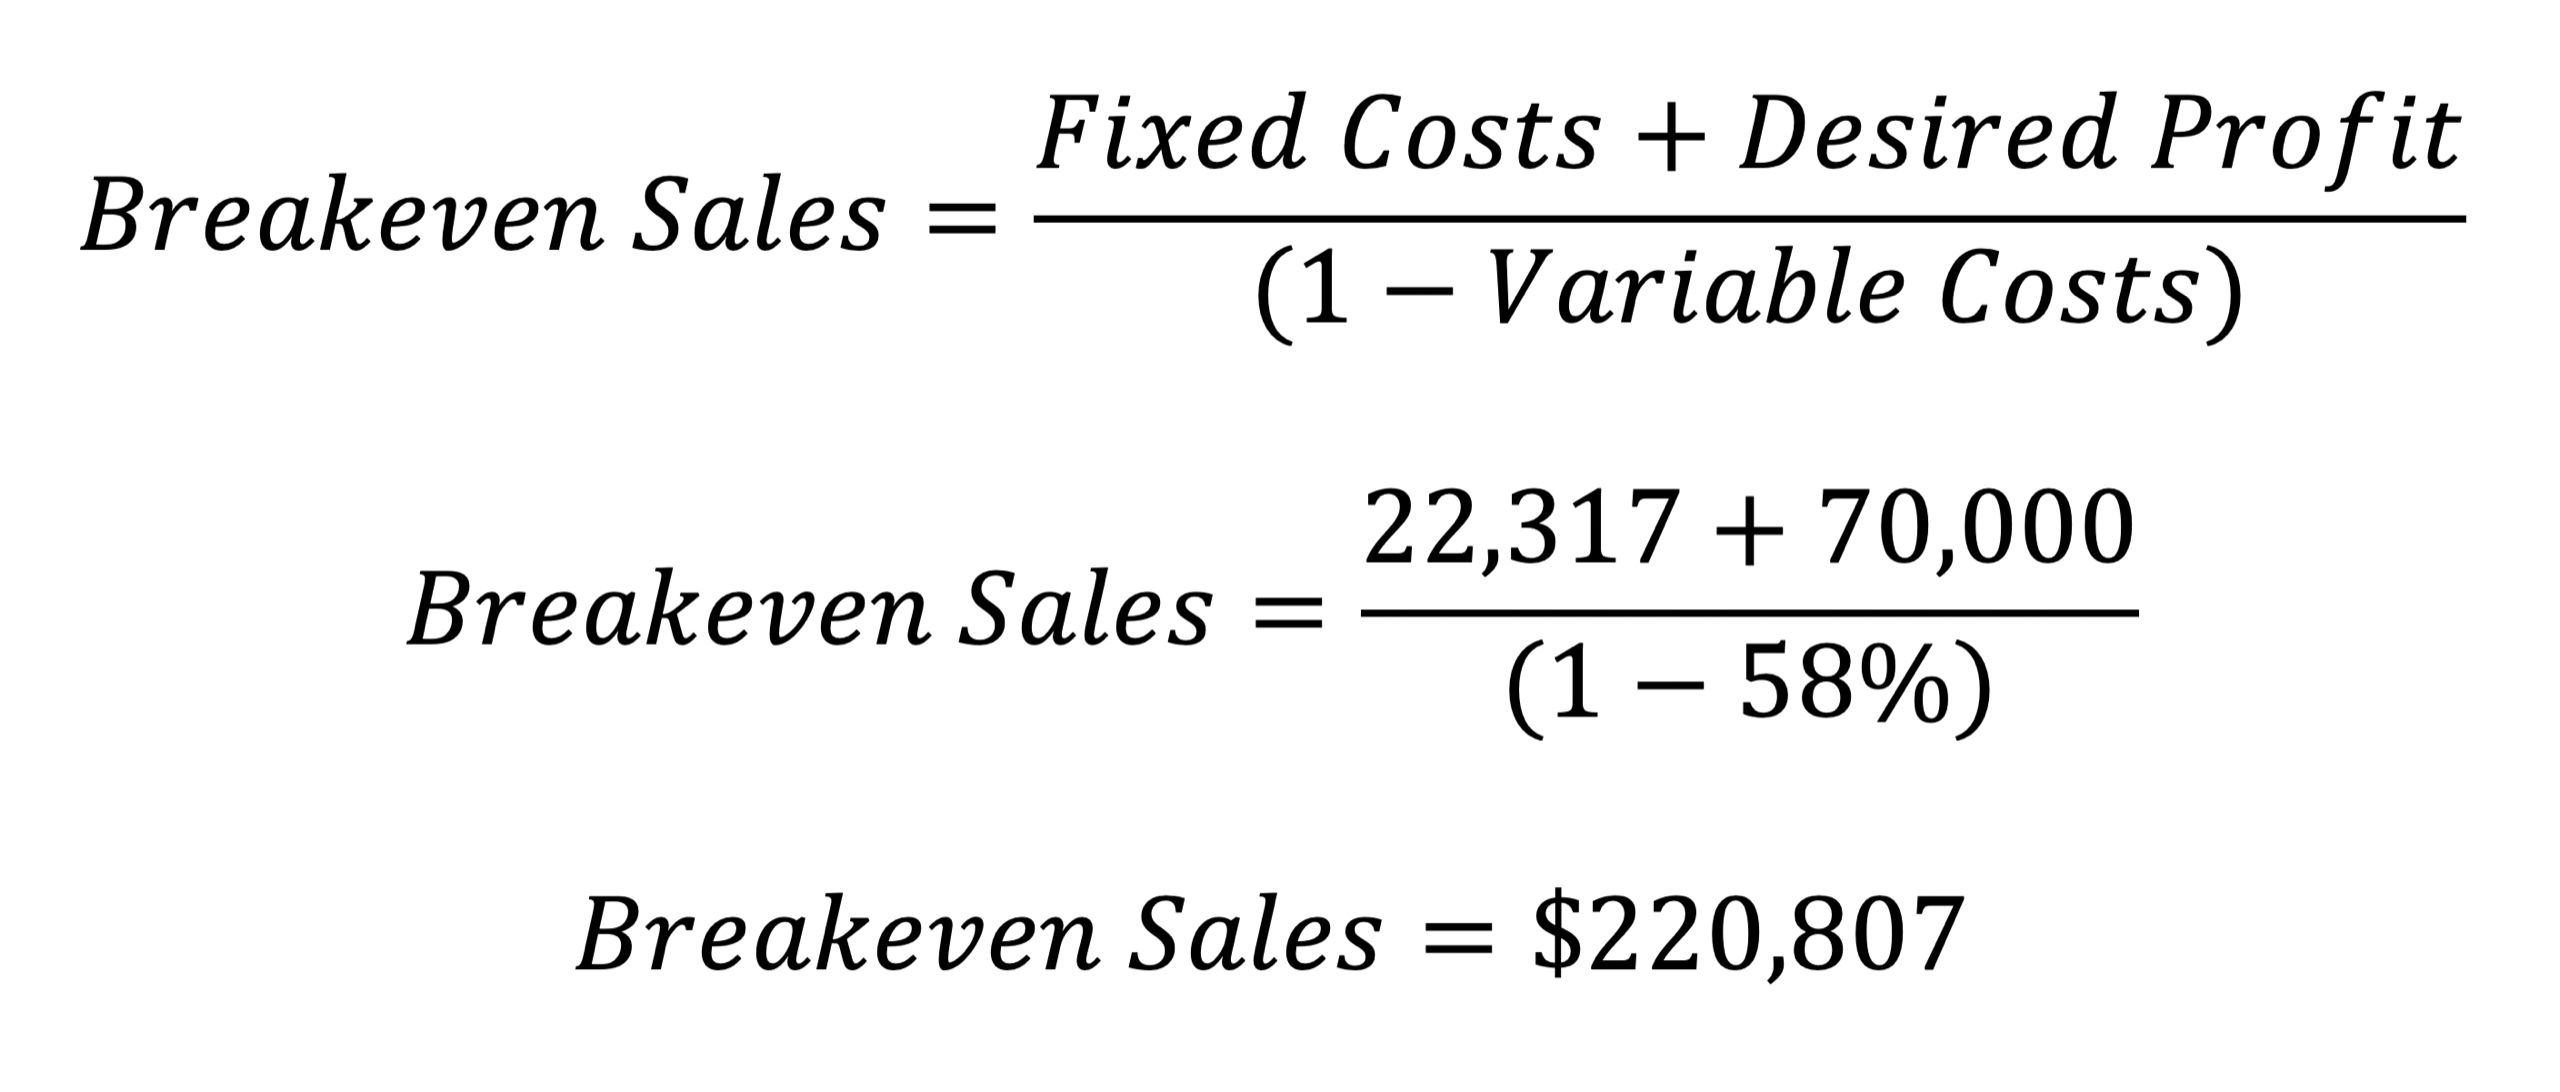
The breakeven sales are a pretty significant jump from previous years’ sales. At this point it’s worth going through the expenses a second time and consider how the expenses may change with the increased sales. Perhaps some of the fixed expenses will be higher (will your liability insurance go up? Will you need to go to more farmers markets and therefore have more market fees) or the variable costs may decrease due to increased efficiencies?
To home in on a realistic number, you’ll want to repeat the process one or two times.
AHHH! We have a defined goal! We know where we want to go.
Creating a sales goal
Now that you have a revenue target, you need to create a sales plan to get there. This sales number can feel elusive if you don’t have specific goals.
I like to break down the number into sales goals by sales channel. Let’s say you sell through farmers’ markets, an honor system farm stand, to restaurants, and via a CSA. You can set targets for each channel.
Farmer Dana broke down her sales goals (rounded up to $225,000) like this:
Revenue projection
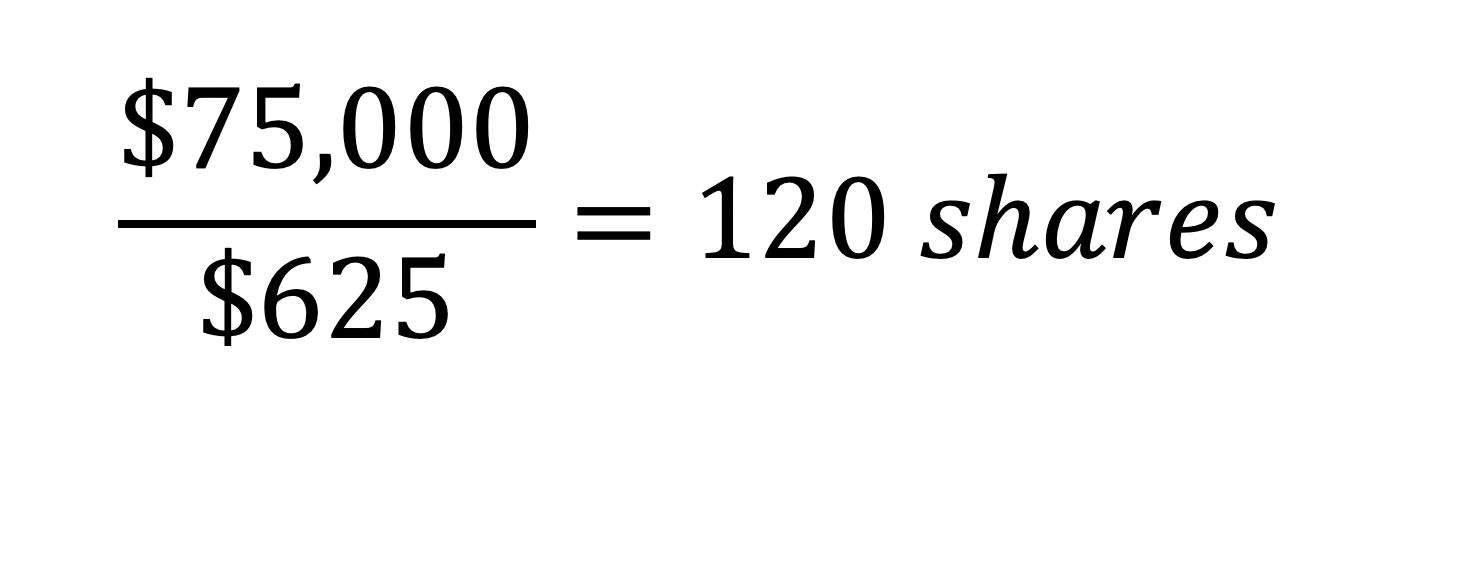
CSA $75,000
Farmers’ Markets $80,000
Restaurants $50,000
Farm Stand $20,000
From here, she can break it down even farther.
CSA
If she sells her CSA for $625 per share, then she needs to sell 120 shares to reach her goal.
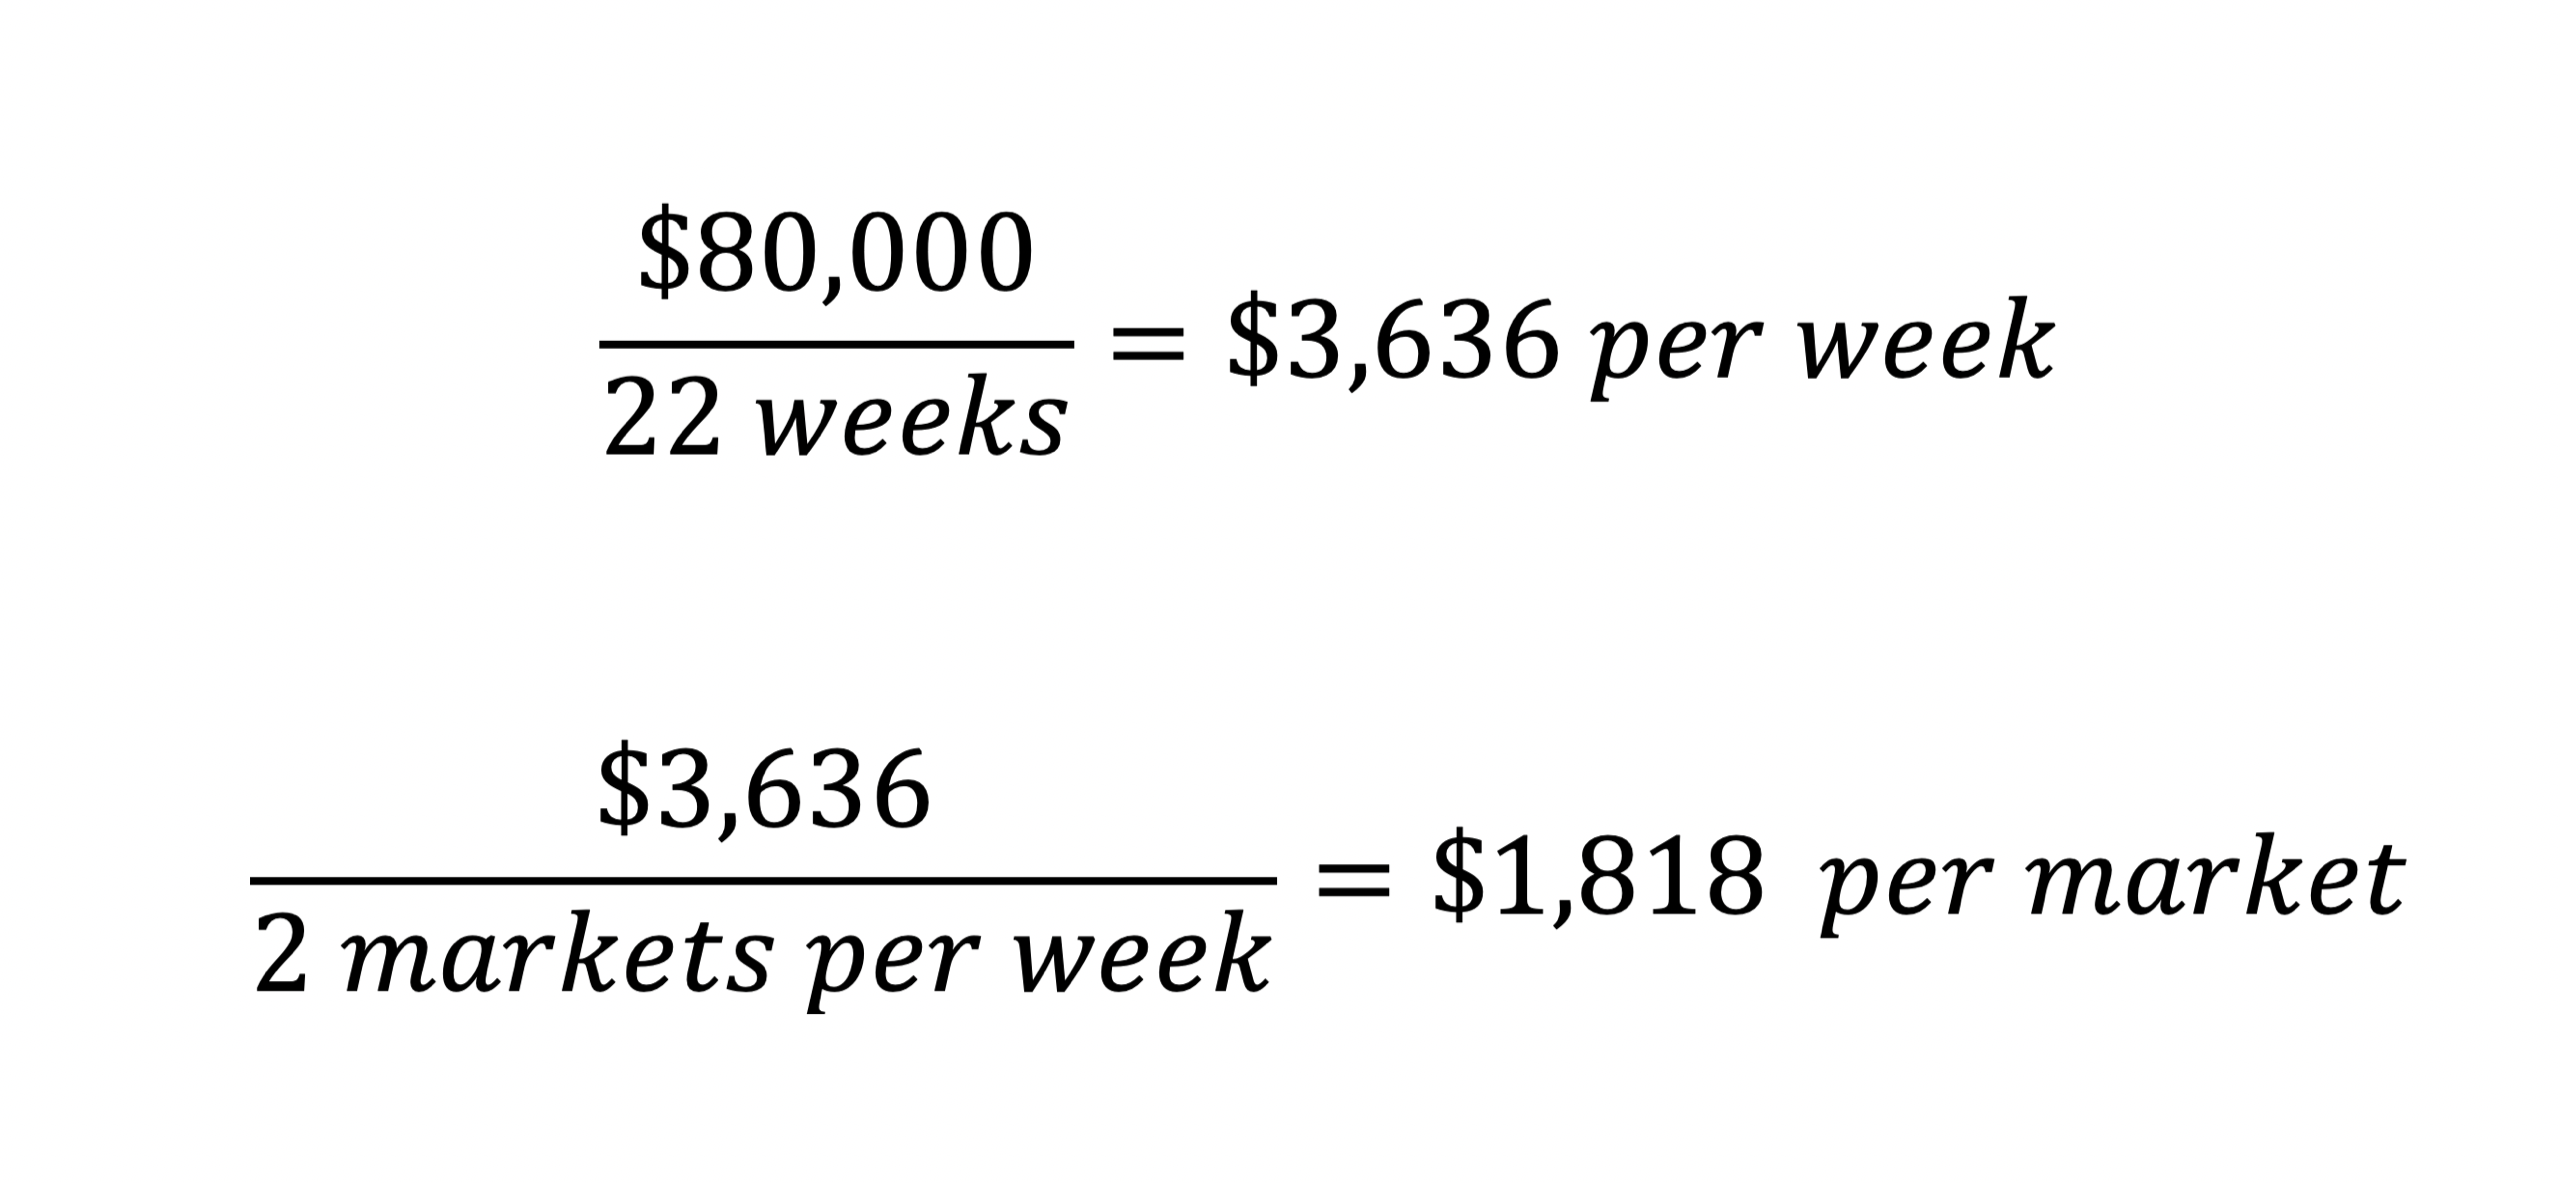
Farmers markets
If she goes to two farmers market each week, and the season is 22 weeks, then she needs to sell on average $1,818 per market. Obviously, early and late in the season, when she has less product, she’ll sell less. And she’ll sell more during peak season.
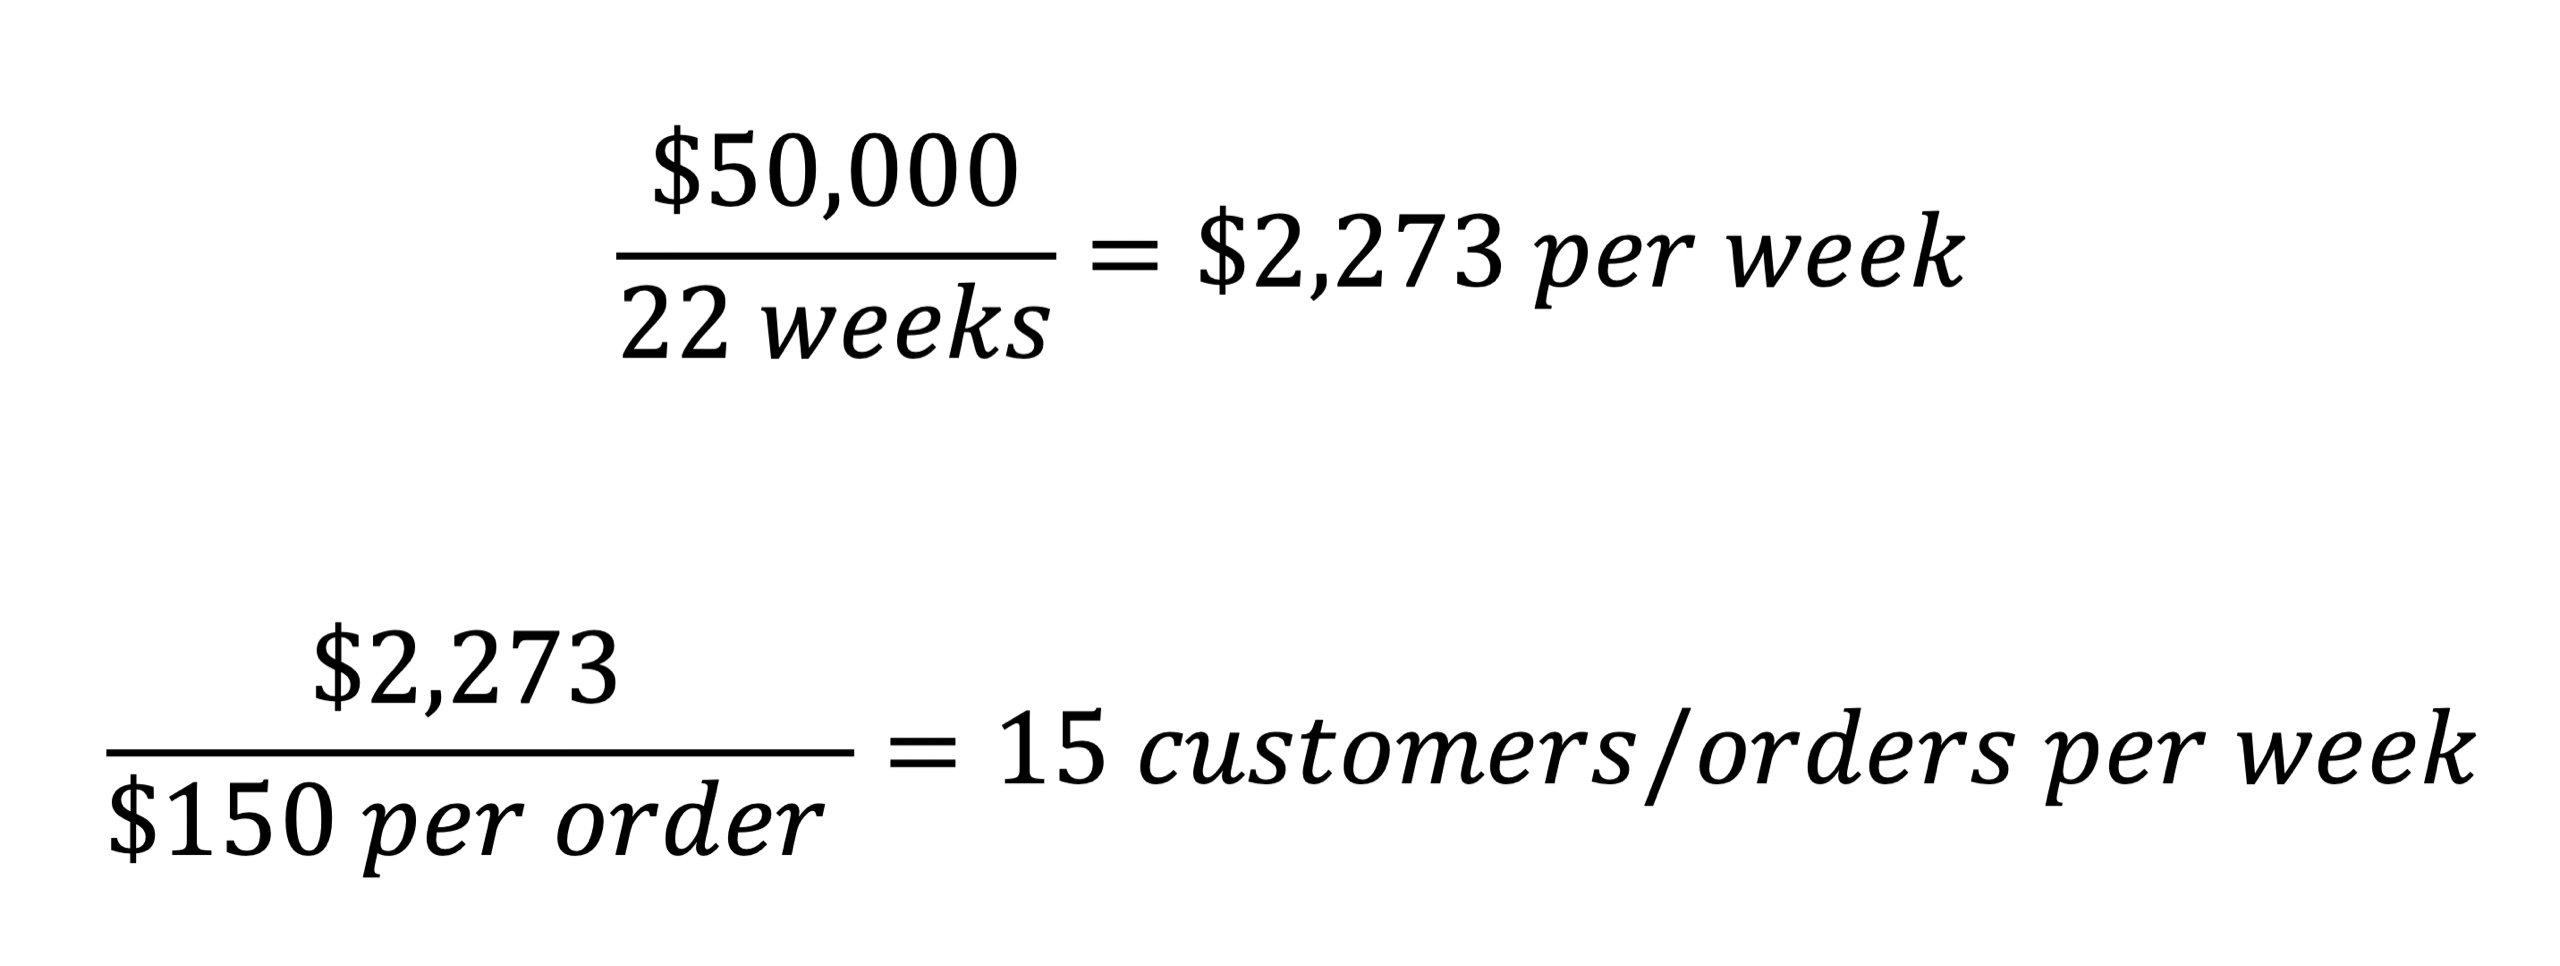
Restaurant
If the average restaurant customer orders $150 per week, and she delivers over a 22-week season, then she’ll need 15 customers.
Farm Stand
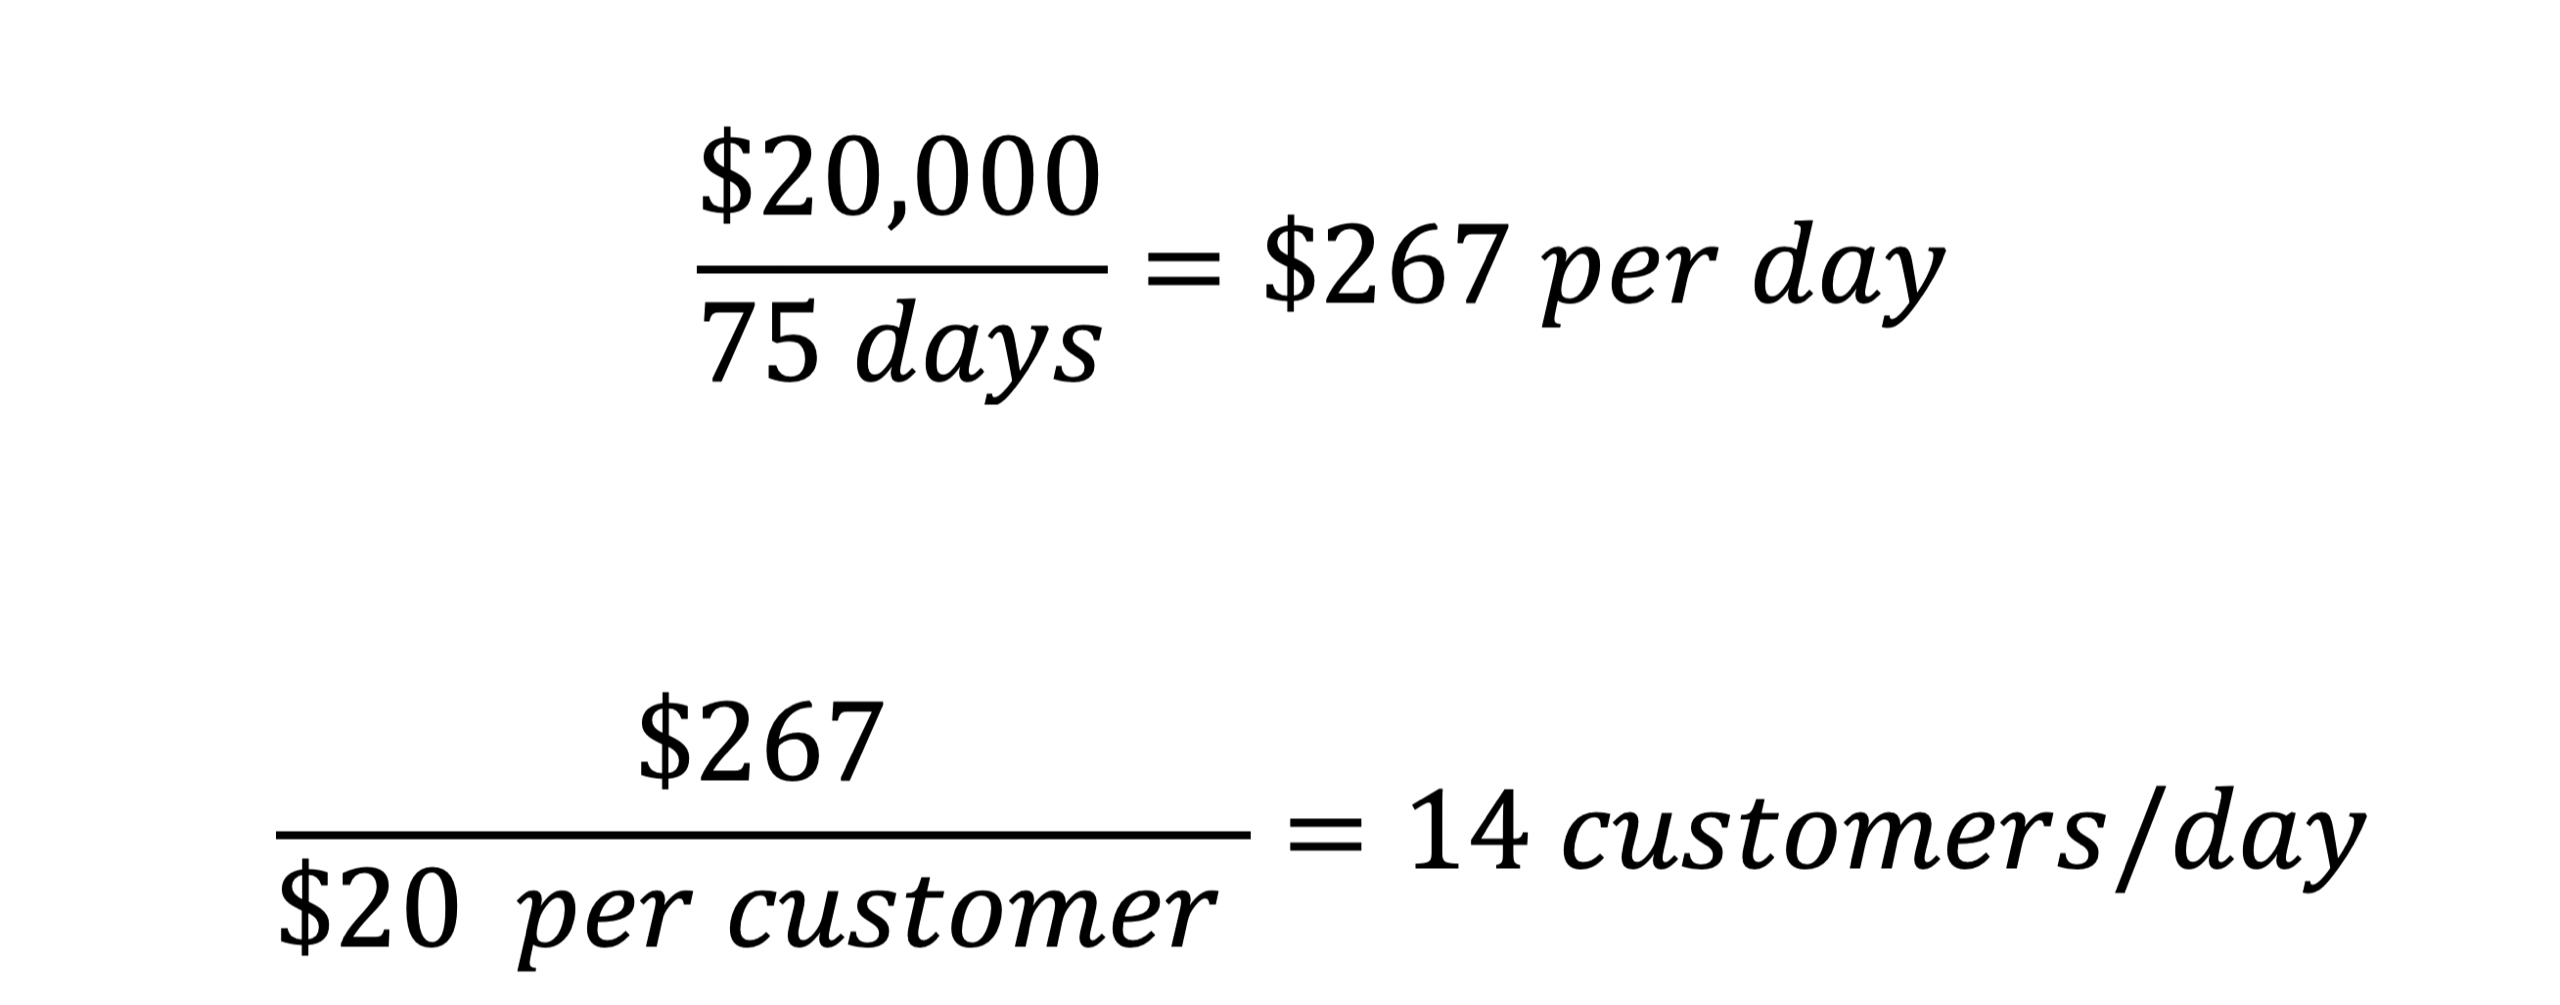
Dana opens her farm stand 75 days a year. On average, her customers spend $20 per visit. She’ll need to have 14 customers per day to reach her sales goals.
Farmer Dana now has very specific sales targets from which she can create a marketing plan. For more thoughts on creating a marketing strategy, see the article “Don’t have a market? Make one!” from the November 2017 GFM.
Certainly, you could take the sales goal of $225,000 and break this down into production goals. How many plantings of carrots and arugula will you need? How many beds of tomatoes? How many layers, meat bird and pigs do you need to achieve these goals? Even with a production plan, you will still want to cross reference your sales plan to make sure you have a reasonable marketplace.
New sales opportunities
We can also use the break-even formula to evaluate new sales opportunities. In last month’s GFM, Jed Beach wrote about branded wholesaling. He outlined some clear advantages, as well as some of the disadvantages – including a lower sales price. You can use breakeven to understand whether branded wholesaling makes sense for you and if you can afford to discount your price.
Let’s continue with the example of Farmer Dana. Given the volume of sales she needs to increase, let’s say that she’s considering adding branded wholesale accounts to her sales mix (her restaurant clients are paying retail prices). She knows that she’ll need to discount her price to get the customers, so she needs to figure out what volume of sales will make it worthwhile.
She looks back at her historical expenses to reassess how she categorized them. She knows that some of her expenses will change if she sells branded wholesale – specifically her packaging and selling time. Of her production costs, she figures that $4,000 is actually packaging. For her payroll, she estimates that $12,000 is actually selling cost, and not production. By her new calculation, her variable costs are closer to $68,000 or 47% of revenue.
We need to translate that variable cost that’s based on retail pricing to a variable cost that’s based on wholesale pricing. If she sells $100,000 worth of produce retail, then her production cost is $47,000. If she sells that same volume of produce through wholesale channels, her production cost will still be $47,000. But since her revenue is lower, the production cost as a percentage will be higher. If she gets $80,000 for that same produce, her variable cost is 59% ($47,000/$80,000).
She thinks about her selling costs and estimates them to be $10,000 per year, and the packaging to be 4.5% of revenue. For this sales channel to work for her, she wants to generate at least $30,000 in gross profits.
We now have all our numbers to plug into our break-even formula.
Fixed Costs = $10,000
Variable Costs = 63.5% (59% + 4.5%)
Desired Profit = $30,000
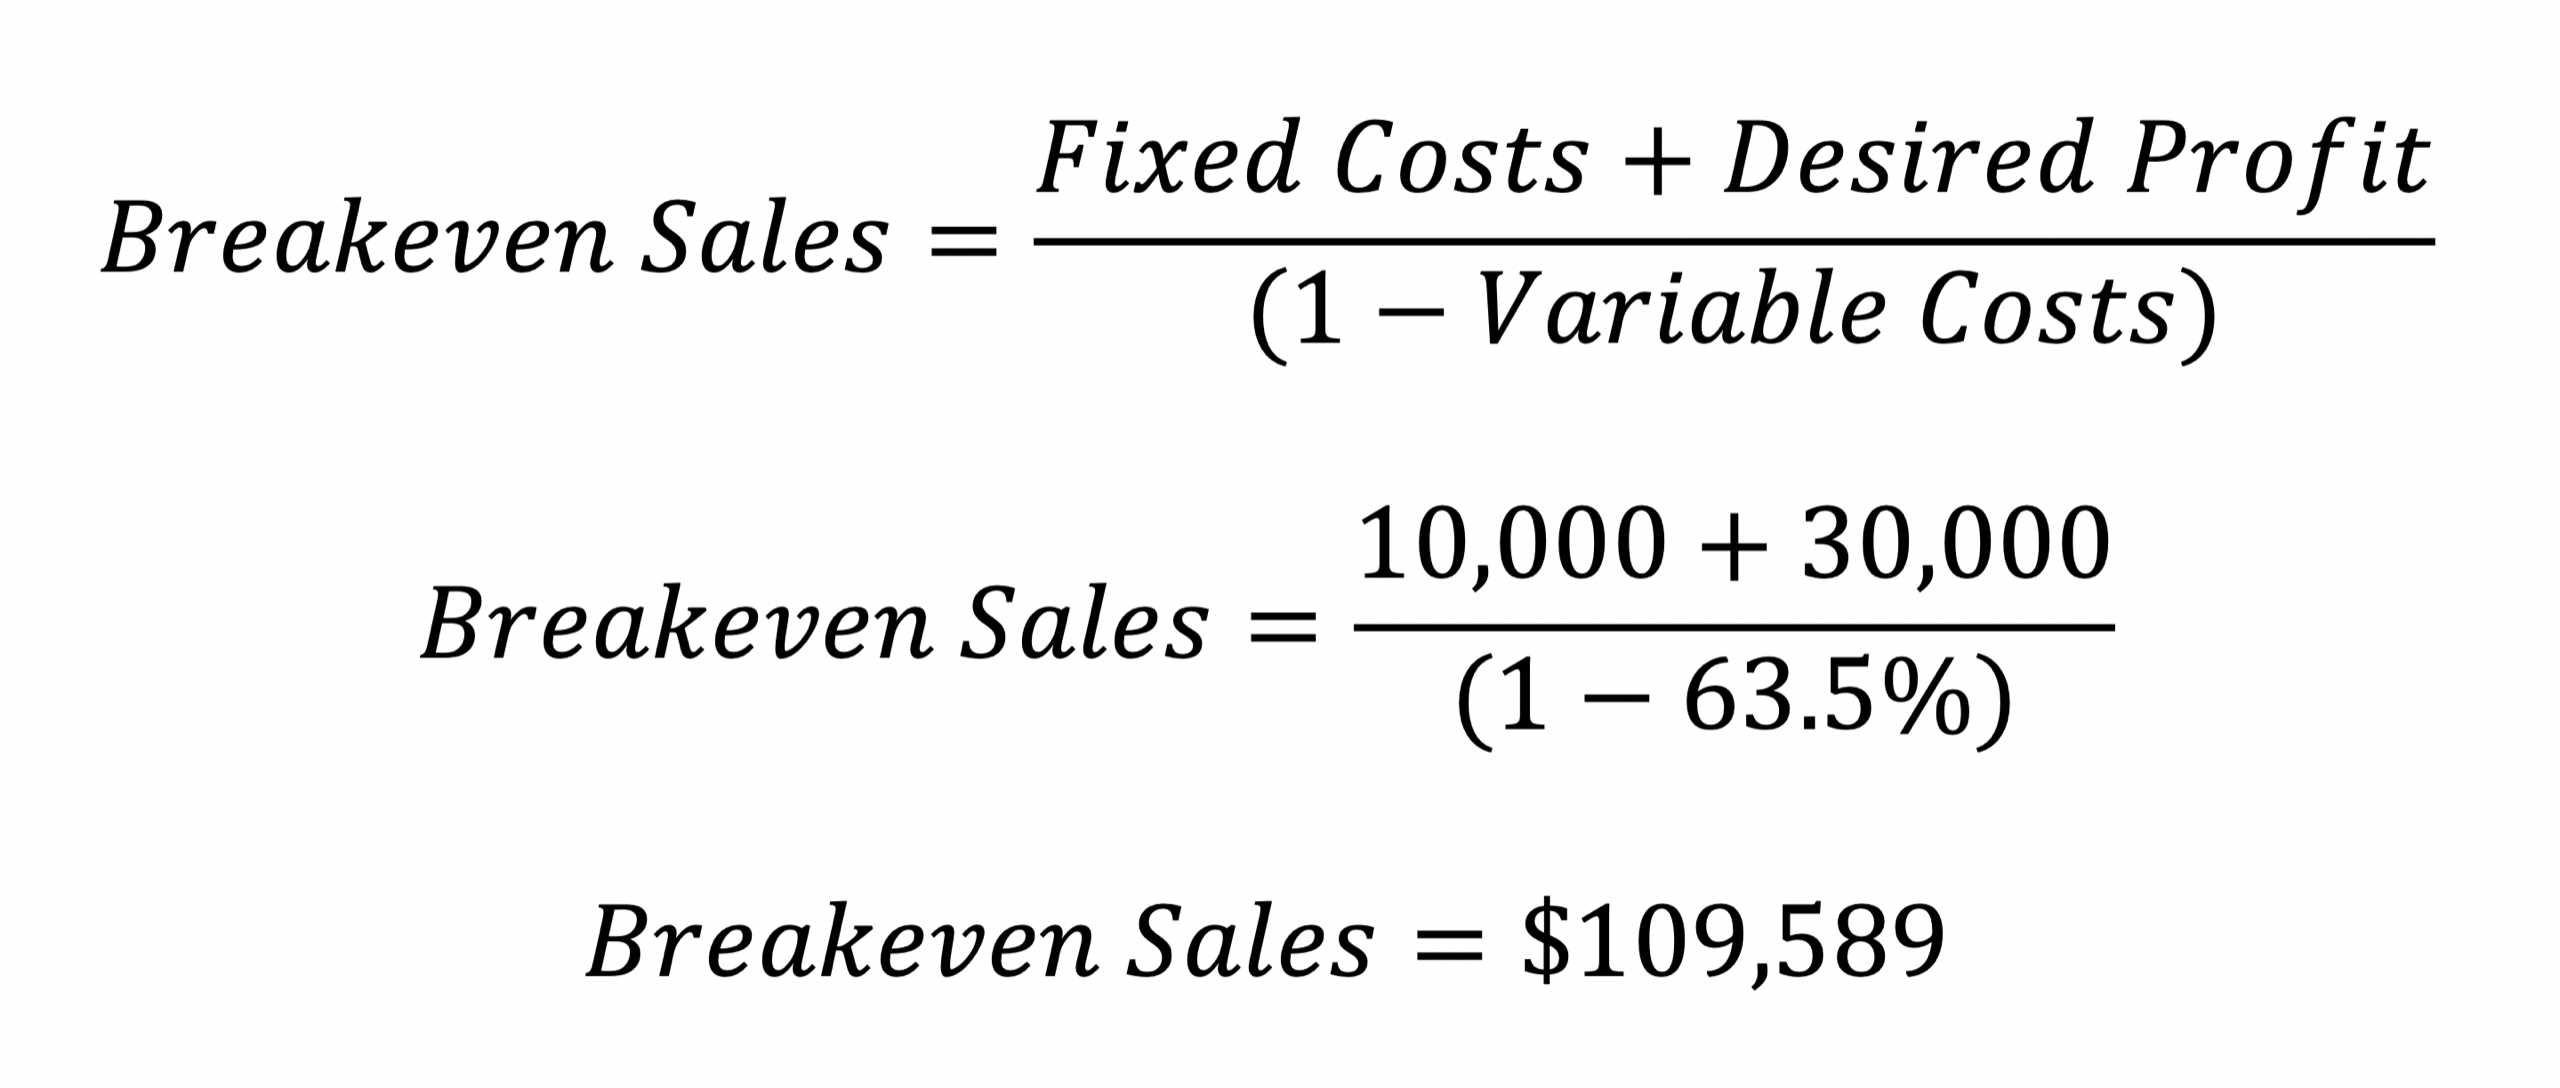
In order for branded wholesale, this new sales channel work for her and achieve her targets, she’ll need to generate at least $109,589 in sales. She now can make a more informed decision if this is a market she wants to pursue.
What’s next?
Through this process, you evaluated your historical expenses to create a sales target and very specific sales goals. To help you achieve these goals you’ll need to:
Create a crop plan that yields enough product to achieve the sales goals
Double check that you can achieve your production goals with the expenses you projected in the breakeven analysis.
Create a cash flow budget based on your updated revenue goals and expense projections so that you have a way to track your progress throughout the year.
As you work through your plan to achieve your goals, you want to make sure you stay on track. Refer back to your budget and compare the actual numbers to your projections. Are you achieving your target sales? Are you keeping your expenses in check and on budget? What adjustments do you need to make? Do you need to revise your marketing strategy to attract more customers? Do you need to revise your customer goals (i.e. the number of customers you need in each category)?
Understanding your sales target is an important first step to achieving your goals. Creating a plan and referring back to it will help ensure you get there.
Here’s to reaching your goals! If you need more support, I invite you to visit my website www.thefarmersoffice.com.
Julia Shanks is the author of The Farmer’s Office and The Farmers Market Cookbook. She works with farming and food entrepreneurs to help them achieve financial sustainability through business planning, cash flow planning and financial feasibility studies; and is a Certified QuickBooks Pro Advisor. You can learn more about her work at thefarmersoffice.com.

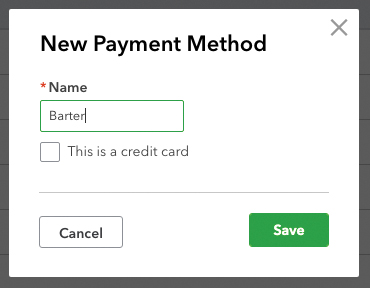 Exchanging goods or services is a common way for farmers to interact with service providers and other farmers. In fact, as a bookkeeping consultant, I often accept payment in the form of pork chops or organic coffee. I know farmers who trade fresh bread for carpentry work and beef for hay mowing. Not all vendors are comfortable with this sort of payment, but when they are, it can add great value to both businesses.
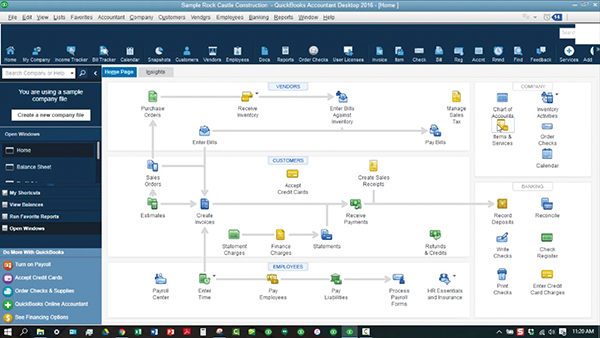 There are a lot of options to consider before picking the best bookkeeping software for your business. One choice a lot of growers have been facing lately is whether to stick with desktop software or move over to the cloud-based software that most developers are switching to.
  Our expectations as farmers are way out of whack. We wear a dozen different hats in a single day: tractor mechanic, HR professional, educator, parent and so many more. Why are we asking ourselves to be our own financial advisors too? The most common message is that, with a bit of focus during the off season, a few tweaks to our daily routine, and a three-hour workshop we will be an expert in QuickBooks and able to set up and run our business’ financial recordkeeping with ease. This is simply not true for most business owners.
 Stop recordkeeping. That’s right, put down your scribbled pencil notes, delete those apps you forget to open and drop that unfinished Excel spreadsheet in the trash. Like most things in life, more is not always better. More recordkeeping cannot lead to more knowledge and better decisions if you have incomplete data or do not turn raw numbers into useable information. It is important to start small, develop good procedures (and habits), and build from there.
 Close your eyes; think about your last trip to visit an accountant. Did you have an awful feeling in the pit of your stomach? Maybe you remembered the growing stack of invoices on your dining room table, or talking about money makes you uncomfortable. Visiting an accountant can feel like a dreaded dentist appointment, but it doesn’t need to and remember it’s an important aspect of a successful farm business.


 Have you ever ended the season feeling like you rocked it with sales and production, yet still have no cash in the bank? You worked your tail off, but there’s nothing to show for it.
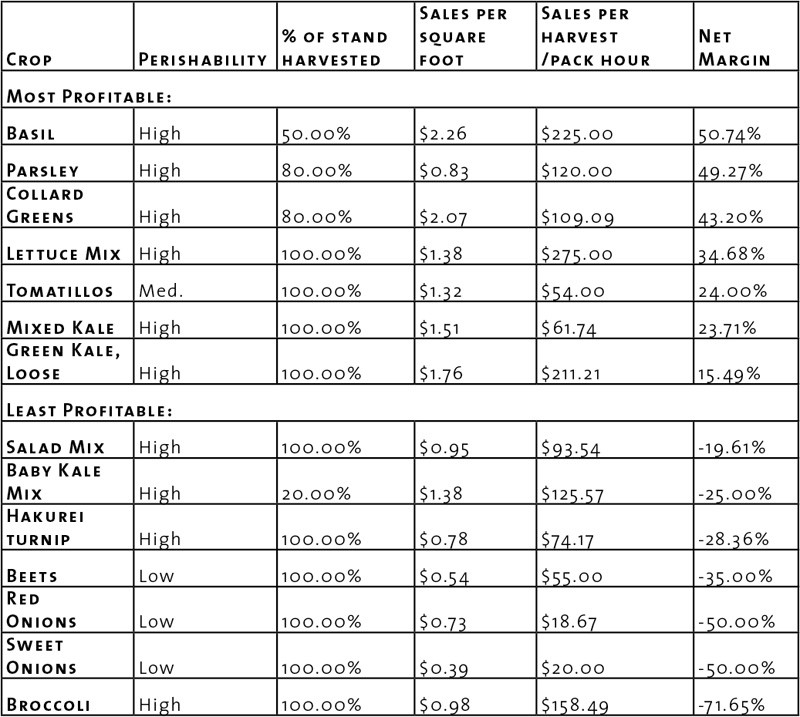 Those of you who read my last article in the May 2018 Growing for Market remember that the method we use to evaluate the potential profitability of our crops is to calculate the “unit cost” for each crop - that is, the minimum price we would need to receive in order to pay all of our expenses and ourselves. Calculating unit cost also provides us with the ability to compare the relative profitability of each crop by comparing each crop’s net margin (Net margin = (Price received - unit cost) / price received).
  Among successful market farms, there is a trend toward diversification and away from specialization. As growers gain experience, they tend to add new crops and markets and extend their seasons. They find ways to maximize income from everything they grow and put all their land to good use.